Webology, Volume 9, Number 1, June, 2012 |
| Home | Table of Contents | Titles & Subject Index | Authors Index |
Shushan Rana
Department of Information Science, Heinrich-Heine-University, Universitaetsstr. 1, D-40225 Duesseldorf, Germany, E-mail: shushan.rana (at) uni-duesseldorf.de
Received May 2, 2012; Accepted June 15, 2012
The main focal point of this paper lies on the appraisal of rising national scientific output in Singapore with the help of bibliometric indicators. This study presents the analysis of 83,439 papers that were published in different ISI-listed periodicals between 2000 and 2009. This study covers year-wise scientific output where Singapore produced an average of more than 8,000 scientific papers per year. Alone in 2008, Singapore produced 10,870 papers, the largest year-wise output during the period reviewed. Along with the discipline-specific publication and citation behaviors of Singapore, some prolific research partners and the dominance of multi-authorship over single-authorship have also been analyzed. The way of communication between the scientists in Singapore has been elaborated with the help of document types and the formats where over 61% of research results were published as articles.
Science; Technology; Bibliometric analysis; Scientific publication; Collaboration; Citation analysis; Authorship; Singapore
Scientific and technological innovations of a developed nation function as its backbones of economics. S&T is the driving force of sustainable growth and development of modern economy (Narin et al., 1997). The modern economy is the economy of S&T. Narin (1976) expressed the need to put more emphasis and concentration on S&T in the following way:
"that scientific activity is related to Gross National Product (GNP), and that, as the economic might of the United States and the Soviet Union have grown over the last 50 years, so have their measured positions in the scientific world."
Everything has become knowledge- and information-based. It is not just about being an active consumer of S&T; it is more about being an active contributor to the world of S&T. Singapore has been able to classify itself as an informational city, along with Seoul and Dubai (Stock, 2011, Khveshchanka et al., 2011). An informational city is an aspect of knowledge society, which is, according to Castells (1989), characterized by the preeminence of "space of flow" (the space or exchange of information, capital, and power) over the "space of places" (geographical space). Central areas of information science - creation, organization, retrieval and dissemination of scientific knowledge or simply STM (Science, Medicine, and Technology) – have been well boosted by advanced ICT and cognitive infrastructures in Singapore. The ICT infrastructures and the cognitive infrastructures are two central facets constituting the concept of informational cities (Stock, 2011).
Scientific knowledge is one aspect of a knowledge city. Singapore, winner of the top MAKCi Award in 2007 and 2008 (The World Capital Institute & Teleos, 2008) is a prominent example of a knowledge city (Stock, 2011). Ergazakis et al. (2004) put emphasis on knowledge-based development through continuous creation, sharing, appraisal, renewal and update of knowledge, which is exactly what a knowledge city aims at.
The ICT infrastructure of an informational city, as observed by Stock (2011), is mainly based on telephony, broadband networks along with internet that form the backbone of the telecommunication nationwide (use of these technologies in private households, in the economy and in governmental institutions).
With the help of NRI (Networked Readiness Index, World Economic Forum), one can see the economic development of a country. In this case, the growing influence and importance of ICT in modern economic growth is a lively example. Singapore was also ranked second behind Sweden in the NRI ranking for the year 2009 (Dutta et al., 2011). As for cognitive infrastructure, two types of activities play a central role (Stock, 2011):
The first activity refers to the extent and impact of S&T publications (also the heart of this paper) and the second activity refers to creative industries. According to Baum et al. (2009), there are six industries representing the core of the creative city: 1) film, television, entertainment, 2) authors, publishers, print media, 3) composers and music production, 4) architecture, visual arts, design, 5) advertising and marketing, 6) performing arts. As for Singapore, such industries are guided by the "Creative Industries Development Strategy" which should contribute to Singapore's economy (Yim, 2009).
Singapore has been leveraging global MNCs and developing indigenous R&D and innovation capabilities. This kind of economic development policy and strategy has a huge and long-term positive effect on the inflow of technology of entrepreneurial communities. They are meticulously critical to the abrupt change in the position of Singapore where they are transiting from an adopter to innovator of technology (Wong et al., 2008).
Despite having below-the-standard industrial bedrock, Singapore came up with the first National Technology Plan (NTP) in 1991. The overall purpose of the NTP – five-year science & technology (S&T) Plan - was to make Singapore one of the most successful S&T-based nations. The first NTP was launched (from 1991 to 1995) with a budget of S$2 billion and had its aim to strengthen Singapore's key enabling factors of manpower, research institutes and technical infrastructure, support for industry R&D and indigenous R&D capability. The National Science & Technology Board (NSTB) was given the task to implement the plan. The second National Science & Technology Plan (NSTP), another five year plan from 1996 to 2000, was released with a S$4 billion budget and was the reinforcement to keep all the activities of the first S&T Plan flow, with more long-term strategic visions. The third Science & Technology 2005 Plan, from 2001 to 2005, had a budget of S$6 billion1. It was based on the first two plans with its focal points on Human Capital Development, Intellectual Capital Development and Industrial Capital Development. The fourth Science & Technology 2010 Plan (2006-2010) was released with a budget of S$13.55 billion which was focused on particular areas of great economic importance and on encouraging private sector R&D. Singapore has already started its fifth Science, Technology & Enterprise Plan 2015 or simply STEP 2015 for 2011-2015 with much stronger commitment to S&T research and innovation and the allocated budget is S$16.1 billion2.
The statistics (1990-2009) show that Singapore enjoyed the increase in its GDP by over 3.7 times, with R&D expenditure of 2.3% of the GDP (0.8% in 1990). Singapore experienced a striking increase of BERD (Business/private expenditure on R&D) from $309.5 million in 1990 to $3,724 million in 2009 (CAGR=14.0%). The Gross Expenditure on R&D (GERD) increased from $571.7 million in 1990 to $6.0 billion in 2009 (CAGR=13.2%). The number of researchers and engineers also grew from 27.7 per 10,000 workers in 1990 to 87.8 per 10,000 workers in 2009.
Similarly, Singapore has been getting a good result as far as R&D patents are concerned. In the year 1993, altogether 142 R&D patents were applied whereas the number of patents applied in 2009 was 1,569 (CAGR= 16.2%). Out of the patents applied in 1993, the number of patents granted was only 52 whereas in 2009 it was 747 (CAGR=18.1%).
As observed, Singapore has been raising its investments quite heavily in R&D and all those excellent results in terms of fast growing S&T output during the last 20 years with its positive impact even on international level is a clear indication that the strategic allocation of such heavy budgets has been paying off. The analyses of S&T, the driving forces of modern society, are indispensable in all kinds of national policies and strategies (Moed, 2002). Bibliometric analyses give an insight into dynamics of R&D activities and are very helpful to administrators and policy makers in making policies and strategies. Such data helps understand the status of a certain nation in the S&T world. The S&T output in Singapore in terms of scientific publications in international journals, their impact, which comes under citation analysis, in respective fields and their trend are vital factors to be identified.
This paper is a part of a research project on "Informational Cities" that took place in the Department of Information Science at the Heinrich-Heine-University, Duesseldorf, Germany. The aim of this paper is not only to provide the stand of Singapore, an informational city, in the world of S&T in terms of scientific productivity and its impact in the S&T society, but also to flash out possible fundamental ingredients for further research. Bibliometric studies of S&T are a process, not just a result. Such studies have to be brought off on a regular basis to keep eagle-eyes on how R&D is shaping the economy of Singapore. Since Singapore conducts five-year S&T Plan, this kind of bibliometric study has to be performed according to the same frequency and timetable but independently.
The online version of the Thomson Reuters' Web of Science database (SCIE, SSCI, A&HCI) was explored for the extraction of publication data for the period 2000-2009. A total of 83,439 publication records were downloaded for this analysis in December, 2010. The indicators calculated from the given data were: publication-year, types of documents, single- & multiple-authorship and countries to which authors belong, research partners of Singapore on national level, major scientific disciplines, number of documents published yearly, titles of publications, co-publication by major scientific fields and number of citations for the given documents per year. After the download was complete, additional measures were taken in order to exclude inappropriate data. Every publication involving international collaboration was assigned to all the countries involved. Hence such publications were counted several times. Data were locally hosted and no serious difficulties were experienced during data retrieval, assignment of papers to different scientific disciplines or in other similar cases. MS Access and MS Excel were used for computation and analysis of these data in obtaining the required bibliometric indicators for the study.
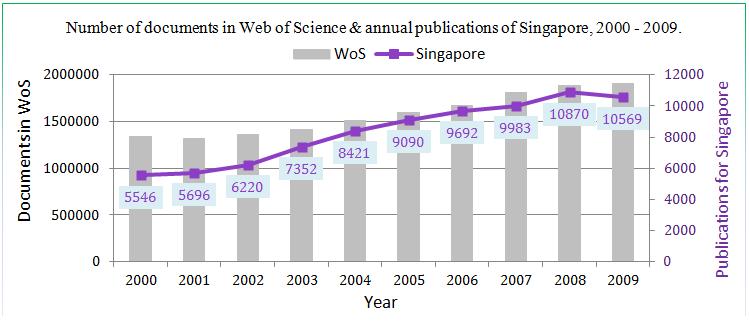
This section provides a thorough analysis of the scientific output of Singapore for the period reviewed. As depicted in Figure 1, an increase in publication output over the given period can be seen. If we compare the output in the year 2000 with that in 2009, we can clearly see that, the number of publications has almost doubled.
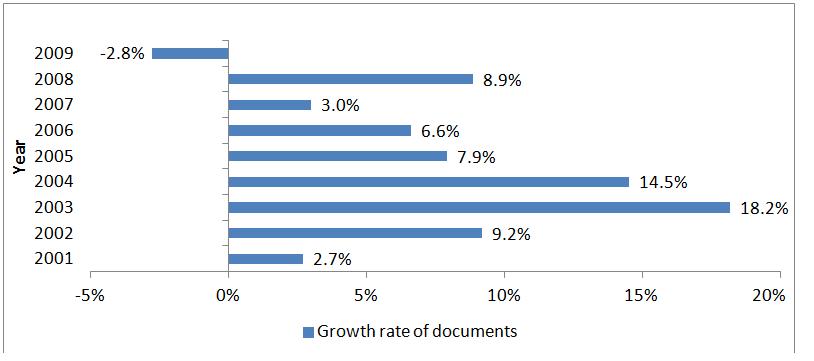
Quite apart from the fact that there were some fluctuations in the number of publications every year, an increasing trend can be well observed. The publication productivity of Singapore grew quite significantly, showing increases of 2.7% and 9.2% for two consecutive years 2001 and 2002 (Figure 2). The largest increases that Singapore experienced were at 18.2% and 14.5% for 2003 and 2004 respectively. There was a decrease in 2009 (-2.8%). The largest number of papers was produced in the year 2008, with an increase of 8.9% with respect to that in the previous year.
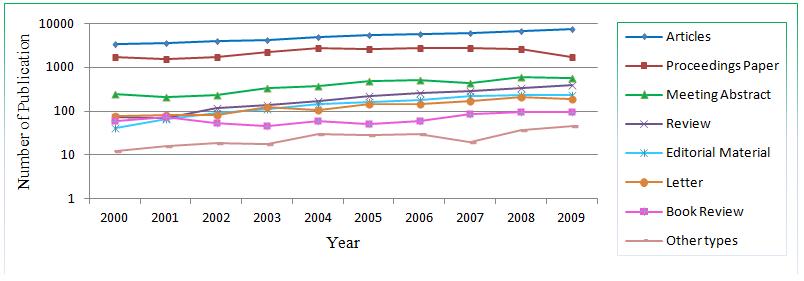
The scientists in Singapore performed the communication of their research results through different publication formats. Table 1 elaborates the distribution of publications throughout the period reviewed; where over 61% of the research results were published in the form of articles. The second most popular format of communication were Proceedings Papers (26.94%), followed by Meeting Abstracts (4.77%), Reviews (2.45%), Letters (1.60%), Book Reviews (0.81%) and other types of publications (0.30%). Due to a very small number of some publications or document types and a minimum degree of research aspects, they are taken together as 'Other types' to make it easier for the calculation and understanding, along with their scientific scope.
By observing the output, one can see that journal articles stand out among others and what is really striking in the year 2009 is that Articles (69.2%), Proceedings Papers (16.5%), Meeting Abstracts (5.6%) and Reviews (3.6%) together can be seen accounting for over 94% of all publications for this year.
| Year | Articles | Proceedings Papers | Meeting Abstract | Review | Editorial Material | Letter | Book Review | Other types | Overall |
|---|---|---|---|---|---|---|---|---|---|
| 2000 | 3324 (6.5) | 1715 (7.6) | 241 (6.1) | 75 (3.7) | 40 (2.7) | 79 (5.9) | 60 (8.8) | 12 (4.7) | 5546 |
| 2001 | 3601 (7.0) | 1585 (7.1) | 206 (5.2) | 70 (3.4) | 65 (4.4) | 80 (6.0) | 73 (10.8) | 16 (6.2) | 5696 |
| 2002 | 3908 (7.6) | 1716 (7.6) | 236 (5.9) | 115 (5.6) | 90 (6.0) | 83 (6.2) | 53 (7.8) | 19 (7.4) | 6220 |
| 2003 | 4299 (8.4) | 2288 (10.2) | 329 (8.3) | 140 (6.9) | 111 (7.4) | 122 (9.1) | 45 (6.6) | 18 (7.0) | 7352 |
| 2004 | 4845 (9.5) | 2694 (12.0) | 376 (9.4) | 166 (8.1) | 144 (9.7) | 107 (8.0) | 59 (8.7) | 30 (11.7) | 8421 |
| 2005 | 5363 (10.5) | 2633 (11.7) | 481 (12.1) | 222 (10.9) | 164 (11.0) | 148 (11.1) | 50 (7.4) | 29 (11.3) | 9090 |
| 2006 | 5741 (11.2) | 2765 (12.3) | 515 (12.9) | 256 (12.5) | 181 (12.1) | 146 (10.9) | 58 (8.6) | 30 (11.7) | 9692 |
| 2007 | 6004 (11.7) | 2754 (12.3) | 443 (11.1) | 281 (13.8) | 222 (14.9) | 172 (12.9) | 87 (12.8) | 20 (7.8) | 9983 |
| 2008 | 6776 (13.2) | 2580 (11.5) | 601 (15.1) | 332 (16.3) | 237 (15.9) | 210 (15.7) | 97 (14.3) | 37 (14.4) | 10870 |
| 2009 | 7316 (14.3) | 1746 (7.8) | 555 (13.9) | 385 (18.9) | 237 (15.9) | 188 (14.1) | 96 (14.2) | 46 (17.9) | 10569 |
| Overall | 51177 | 22476 | 3983 | 2042 | 1491 | 1335 | 678 | 257 | 83439 |
| % | 61.33 | 26.94 | 4.77 | 2.45 | 1.79 | 1.60 | 0.81 | 0.30 | 99.99 |
If we look at the percentage of publications in each document type for the particular year 2007 (Zhang et al., 2011), Singapore does not lag far behind those countries with the most publications (Table 2). As far as Review, Editorial Material, Letter are concerned, Singapore did even better than China and Japan. The percentage of Book Review is also better than the others except UK. Figure 3 should give a clearer vision on the fluctuation in number of publications, the rising and the falling trend of different publication types.
| Country | Article | Meeting Abstract | Review | Editorial Material | Letter | Book Review | Total papers |
|---|---|---|---|---|---|---|---|
| USA | 66.5 | 19.4 | 5.0 | 5.4 | 2.4 | 0.6 | 392,488 |
| UK | 65.9 | 16.2 | 5.9 | 5.5 | 4.6 | 1.2 | 104,561 |
| Germany | 72.3 | 17.4 | 4.6 | 3.2 | 1.7 | 0.1 | 95,892 |
| China | 92.0 | 4.8 | 1.5 | 0.7 | 0.6 | 0.0 | 95,231 |
| Japan | 78.8 | 15.4 | 2.6 | 1.2 | 1.5 | 0.0 | 89,575 |
| Singapore | 61.3 | 4.4 | 2.8 | 2.2 | 1.7 | 0.9 | 9983 |
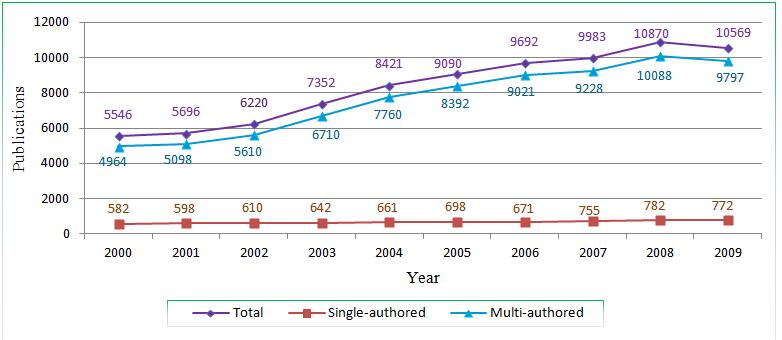
Derek John De Solla Price (1963) came up with a work called "Little Science, Big Science" where he explained the trend of and highly appreciated scientific research collaboration among authors. He also presaged that "by 1980 the single – author paper will be extinct." Such trends characterize both the social and the cognitive structure of scientific research realms (Glänzel, 2002). Scientists have a burning desire for reputation, recognition, visibility and the benefit they win through the exchange of tools, skills and expertise from colleagues (Katz et al., 1997). Although this paper, as observed in the case of Singapore, does not corroborate this particular prediction, one can, however, see the superiority of multiple authorship. Figure 4 provides the number of single- and multi-authored papers during the observed 10-year period.
The result shows that just 8.1% of total papers involved single authors. An astonishing 91.9% of papers were multi-authored. As for single-authored papers, in 2001, it was a 2.7% increase but was just 2.0% in the following year. The largest increase was 12.5% for the year 2007 and then again started sinking. There was a decrease in 2006 (-3.9%) and in 2009 (-1.3%). As for multi-authored publications, the relative increase rate was larger. The greatest increase was in 2003 at 19.6%, followed by 15.6% in the following year. Here too, Singapore experienced a decrease in 2009 (-2.9%). In a study performed by Glänzel (2002), it was found out that multi-authored papers were dominant over single-authored papers although the study was restricted to just three subject fields – Biomedical Research, Chemistry & Mathematics.
The count of scientific publications in certain fields of research shows the emergence of national strengths in particular areas. On classifying this publication output in S&T under these twelve disciplines, it can be well observed that the scientific productivity of Singapore emanates from Engineering with the highest percentage of publications (32.9%), followed by Medicine (21.0%), Physics (20.1%) and Information & Computer Science (14.5%). Medicine, however, is the discipline with the highest publication count on a global scale (Haustein et al., 2010). Agricultural Science had the least count of publications (0.7%). All the publications have been assigned to 12 disciplines as shown in Figure 5.
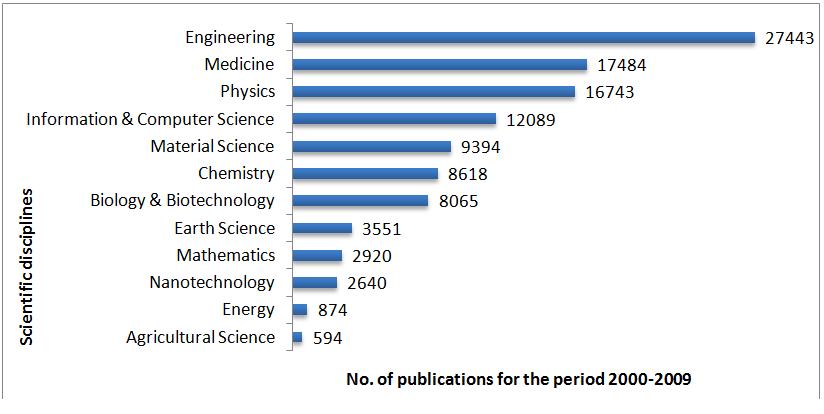
For the purpose of finding out in which disciplines Singapore is putting more emphasis or intensity, the data for the year 2008 has been taken, where only articles and reviews are included. Singapore accounted for 0.5% (9,477 articles & reviews) of the total worldwide output of 18,44,921 articles and reviews in twelve disciplines. Due to different publication and citation rates exhibited by different disciplines (Haustein et al., 2010), the output has been normalized with respect to the worldwide total output in the given twelve disciplines.
Singapore produced 2.4% of the world's total publications in Nanotechnology, topping the rest of the disciplines in the list (Figure 5). It is followed by Information & Computer Science, in which 1.8% papers were produced. Disciplines like Engineering (1.6%), Physics (1.1%), and Material Science (1.4%) lie over 1%, which is a very significant progress. Singapore trails far behind as far as Agricultural Science is concerned. Singapore produced only 0.2% of the total output. This domain is also the one in which the least papers were published for the whole ten-year period.
The publication profile of a nation reveals its strengths and weaknesses in terms of scientific productivity. This study shows that Singapore does not have a balanced profile as far as such output is concerned, in contrast to the developed countries shown by previous studies. The strategic policies of NTP in Singapore's S&T can hence be seen clearly in some of the scientific fields. These are the areas with the highest priority. Singapore has been investing more and more funds in these particular S&T fields because of their greater economic and societal importance, as seen in the case of engineering, medicine, physics and so on and what is striking is that Nanotechnology has done pretty well as far as share in the world output is concerned. Singapore is also continually deepening its research capabilities in areas like chemicals, electronics, biomedical sciences and ICT. It needs to increase its R&D capabilities in other sectors for sustainable economic growth and competitiveness.
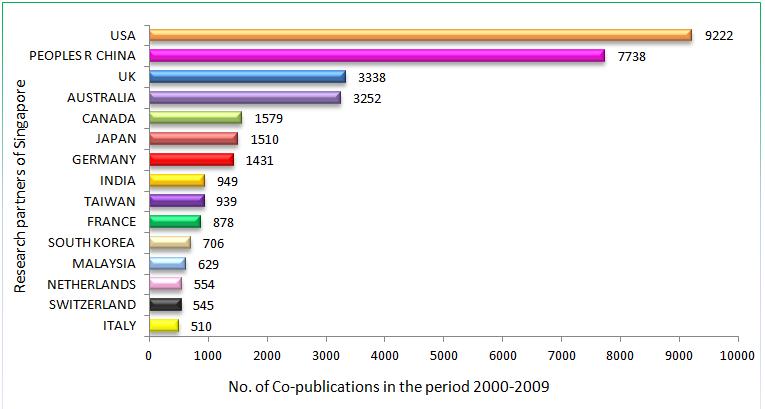
Except quantitative and qualitative analysis of scientific output, the international collaboration analysis in S&T or simply co-publication analysis, another important facet of bibliometrics, has been discussed here. Figure 6 shows the co-publication activity of Singapore with different countries. Singapore's scientific research publication activity is heavily associated with international cooperation. The scientists in Singapore co-authored publications with their colleagues mostly from the USA (11.1%), China (9.3%), and the UK (4.0%). Except these three heavy-weight research partners, the co-publications are growing astonishingly with scientists from the regional neighborhood like Australia (3.9%), Japan (1.8%), and South Korea (0.8%). Germany has just 1.7% co-authorship, much ahead of the Netherlands though, which shared 0.7% of the papers.
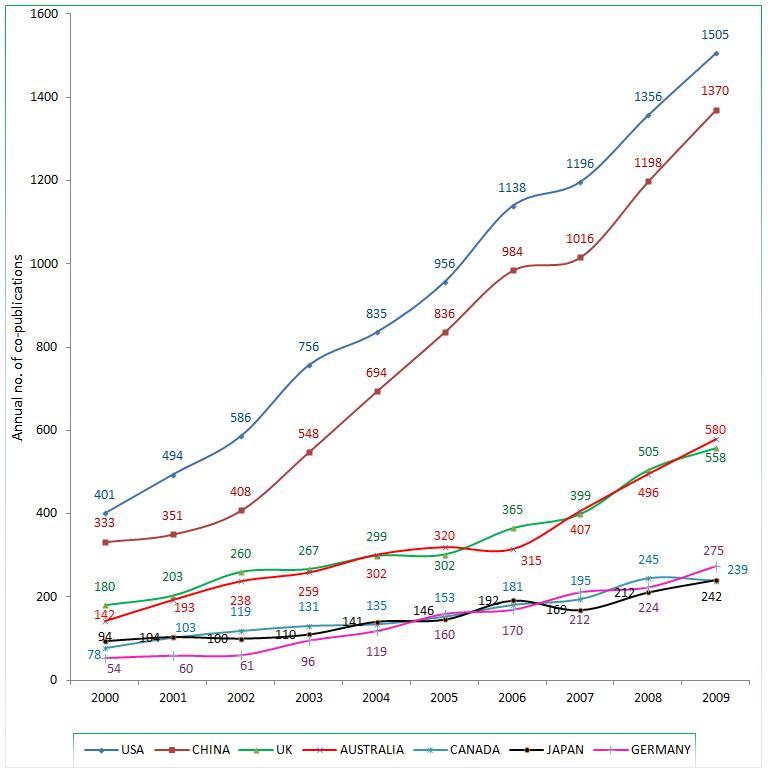
Figure 7 represents the trend of scientific co-publication of Singapore with other countries over the given period. In the year 2009, Singapore and the USA co-authored papers (1505 co-publications with an increase rate of 10.9% compared against that in 2008) which is almost four times more than that in 2000 (401 co-publications). The largest increase percentage of collaboration between them was in 2003 at 29.0% but still less than that with China, which was at 34.3% for the same year.
China came quite close to the USA with almost the same proportion. Singapore and China co-authored 333 papers in 2000 but it was astonishing 1370 co-publications in 2009 (an increase of 14.4% compared against that for the previous year). Year 2007 represented the lowest point of collaboration with the USA (5.1%) and surprisingly also with China (3.3%). Other partners like UK, Australia, Canada, Japan, and Germany are in the same way becoming more open to Singapore in terms of scientific collaboration.
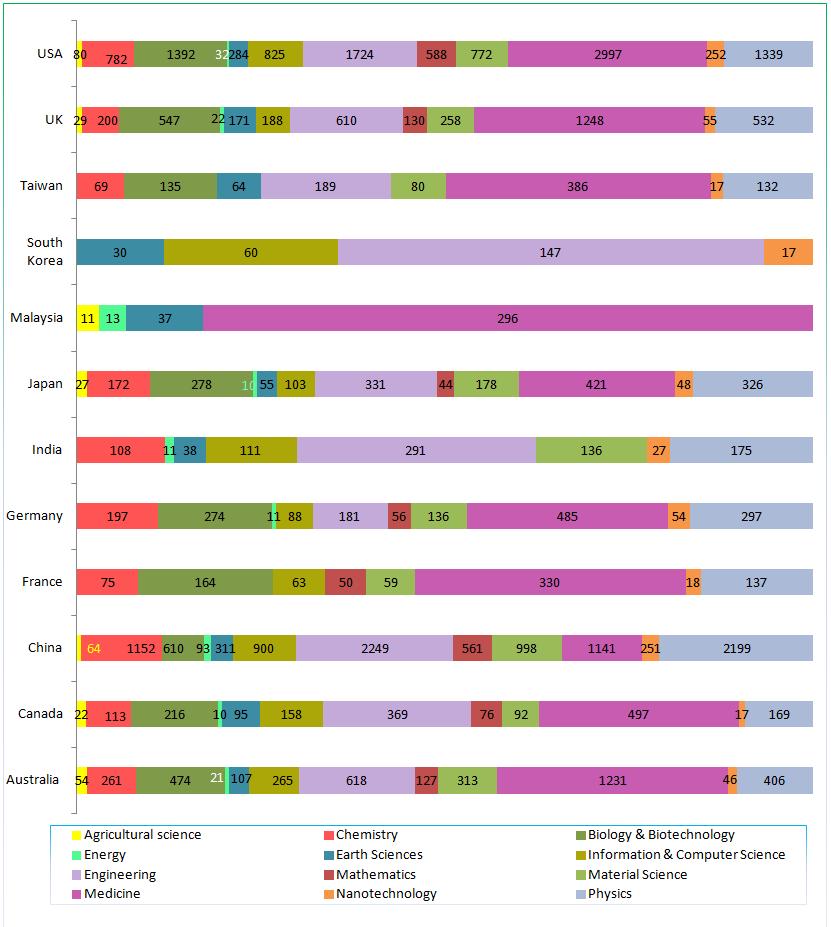
As shown in Figure 8 below, in the field of Medicine, the USA is the strongest partner (2997 co-publications), followed by Australia (1231) and China (1141). However, in engineering science, China surpasses the USA (1724 co-publications) as the largest collaboration partner with 2249 co-publications. Likewise, in other fields like Physics, Chemistry, Information & Computer Science, Material Science, China still sits in the driving seat with 2199, 1152, 900, 998 co-publications respectively. Such kind of collaboration between the scientists in Singapore with those of the giants of S&T like the USA and China is getting its pace steadily, developing the capacity of the former in dealing with problems to stand firmly on the field and gaining scientific reputation.
Singapore has applied a very efficient policy of acquiring and continuously improving foreign technology. Heavy investments in infrastructure, efficient policies in attracting foreign investments, MNCs and at the same time promoting indigenous SMEs were other important thrusts of NTP. Still, Singapore relies heavily on international collaboration, particularly in the fields Medicine, Engineering and Physics. Singapore still lacks technically advanced technologies and skilled man power. Without domestic or international markets caused by the lack of natural resources, Singapore needs time to push up local industries and products without losing foreign investments and companies.
After observing the increase in the number of scientific publications in high impact journals by researchers in Singapore, one is obliged to say that this act of promoting S&T at any cost has been getting outstanding rewards. The scientists in Singapore are publishing research materials of high quality on international level. It shows that Singapore is now experiencing and enjoying its rise of research status internationally, attracting stronger international collaboration and more global partnerships for improvements in research and publication quality. These endeavors and excellent results of Singapore in global S&T in recent years is a perceptible expression of the Mathew Effect (Merton, 1968), where the core understanding is that 'the more you have, the more you will be given'.
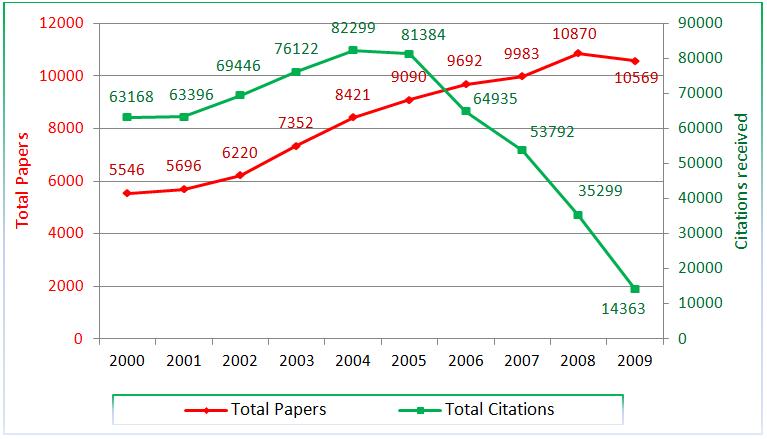
The citation count is the indicator for the impact measure, just as the publication count for the scientific output. This section starts with the proportion of scientific publications and their citations over the given period.
Despite the peak number of papers in 2008, followed by 2009, a clear decline in the number of citations can be observed since 2005. These young papers are not still ripe for frequent citations but it is definitely going to change in the course of time. For instance, in 2009, altogether 10,569 papers appeared in different national and international journals but they accumulated just 14,363 citations, which means just 1.4 citations per publication (CPP) 5. In 2008, the CPP was 3.2. As for 2000, the total citations won peaked with the CPP of 11.9. For the whole period, the CPP comes to be around 1.6. Figure 9 summarizes the total papers published during 2000 – 2009 and the number of citations for each year.
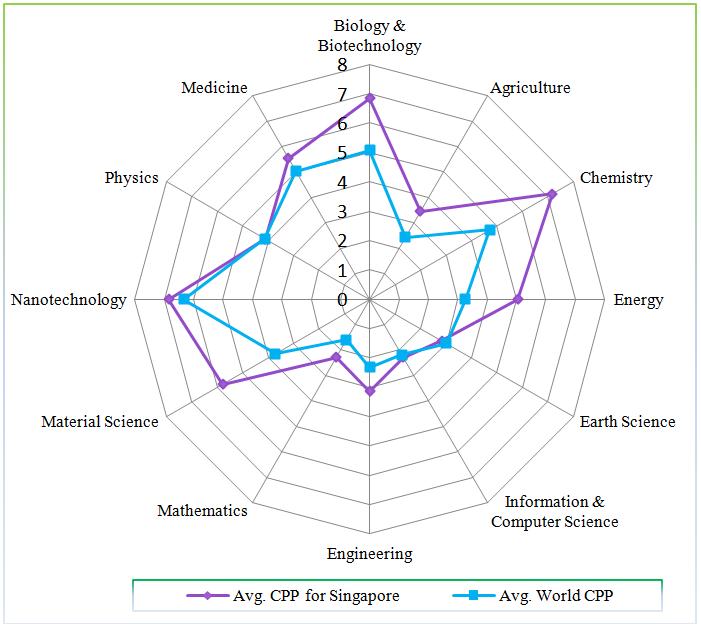
Except for Earth Science where the world average citation rate amounted to 3.0, a bit more than that for Singapore that had 2.3, in all other disciplines, Singapore enjoyed leading the show. For 2008, Singapore was successful in designating itself as a country with the strongest perception and impact in Chemistry with the citation rate of 7.2, far ahead than the world citation rate of just 4.7. For Nanotechnology, Physics and Medicine, they went almost hand-in-hand. The citation rate for Mathematics on a worldwide scale accounted for 1.6, lagging behind Singapore that had 2.3. Figure 10 shows the average citation rate on a global scale and for Singapore for the year 2008.
The multi-authored publications (76,668 papers: 91.88%) accumulated altogether 5,76,385 citations (CPP=7). This amounts to 95% of the whole citations. In contrary, the single-authored publications (6,771 papers: 8.11%) were able to win just 27,819 citations over the period reviewed (CPP=4).
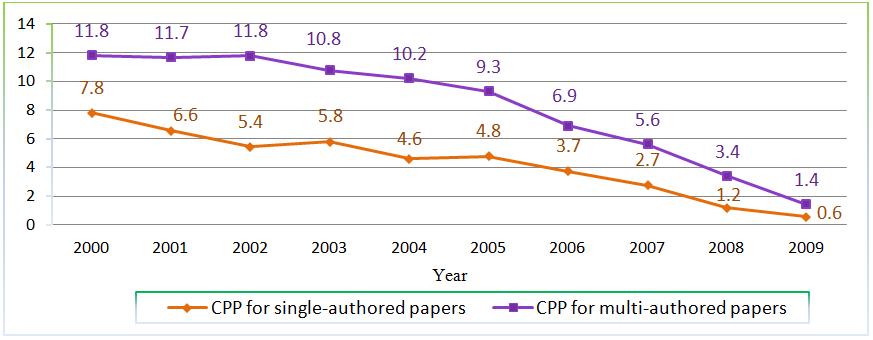
One thing is common in both single- and multi-authored papers and that is, the old publications were the ones to win the largest number of citations than the recent ones in ten years period. In the year 2000, there were 582 single-authored papers, which were able to garner 4,538 citations (CPP=7.8), while 4,964 multi-authored publications for the same year accumulated 58,630 citations, with the CPP of almost 12. The annual citation rates for multi-authored publications were larger than that for single-authored publications. The CPP for single- and for multi-authored papers in the last years went on sinking and in the year 2009, the CPP for the former was just 0.6, still less than that for the latter which had the CPP of 1.4.
Although different scientific fields exhibit different publication and citation behaviors (Haustein et al., 2010), this paper shows that multi-authored papers have greater citation impact than single-authored papers and hence it also supports a previous study done by Glänzel (2002) on three subject fields, despite the fact that this paper covers all twelve subject fields. Figure 11 shows the year-wise citation rates for both kinds of authorships.
This bibliometric study of S&T in Singapore demonstrates two very crucial issues: scientific productivity in terms of quantity and quality. These are considered as proxies that help understand how high a bar is concerning the scientific and technological development of a nation. After Singapore started implementing its S&T visions in 1991, it has never looked back. Investments of a substantial nature on physical infrastructure and in R&D, excellent government policies, strategies, constant acquisition of foreign technologies and their continuous improvement, promoting local SMEs were very decisive in the act of scientific productivity. The scientific output with rising tendency was also quite salient in both the national and international scientific communities which could be well-observed in the citation-statistics. If we analyze research collaboration on international level, Singapore has made it possible for its local scientists to work with their colleagues from abroad, like those from the USA and China. The open economy policies along with global scientific cooperation have made an enormous positive and constructive effect on the S&T performance of Singapore. Moreover, efforts given to the digital infrastructures from both the government and the private sectors have made it possible to coin itself an informational city. Heavy investments in scientific and technological sectors, continuous efforts in making digital and cognitive infrastructures more efficient have been very effective. High-tech local and international industries of information economy, digital libraries, well-trained employees, and other financial enterprises along with political willingness have been crucial for economic development of Singapore.
The author would like to thank Prof. Dr. Wolfgang G. Stock, Department of Information Science, Heinrich-Heine-University, Dr. Stefanie Haustein and Dr. Dirk Tunger, Central Library, Forschungszentrum Juelich (Research Centre Juelich), Germany and the members of the research project "Informational Cities" at the Heinrich-Heine-University Duesseldorf for their valuable insights and expertise.