Webology, Volume 10, Number 1, June, 2013 |
| Home | Table of Contents | Titles & Subject Index | Authors Index |
Ammar Jalalimanesh
Information Engineering Department, Iranian Research Institute for Information Science and Technology (IRANDOC), Tehran, Iran. E-mail: jalalimanesh (at) irandoc.ac.ir
Seyyed Majid Yaghoubi
Computer Engineering Department, University of Science and Technology, Tehran, Iran. E-mail: majidyaghoubi (at) comp.iust.ac.ir
Received May 5, 2012; Accepted June 10, 2013
This paper aims to analyze interlibrary load (ILL) services' network using Social Network Analysis (SNA) techniques in order to discover knowledge about information flow between institutions. Ten years (2000 to 2010) of logs of Ghadir, an Iranian national interlibrary loan service, were processed. A data warehouse was created containing data of about 61,000 users, 158,000 visits and 160,000 borrowed books from 240 institutions. Social network analysis was conducted on data using NodeXL software and network metrics were calculated using tnet software. The network graph showed that Tehran, the capital, is hub of Ghadir project and Qazvin, Tabriz and Isfahan have the highest amount of relationship with it. The network also showed that neighbor cities and provinces have the most interactions with each other. The network metrics imply the richness of collections of institutions in different subjects. This is the first study to analyze logs of Iranian national ILL service and is one of the first studies that use SNA techniques to study ILL services.
Interlibrary loan; Information services; Document delivery; Document supply; Interlending; Social network analysis; Iran
The network that is also called graph is a mathematical representation of elements that interact with or relate to each other. The elements are called nodes or vertices, and links connecting them are called edges. In some networks, the edges are weighted, denoting that they have stronger relations. Network analysis techniques are used to analyze different networks. The network paradigm has been used in many different fields to conceptualize interactions among actors. Most of the concepts of network analysis such as centrality or equivalence are highly applicable across fields (Borgatti & Li, 2009).
Network analysis can be used to discover in-depth knowledge from related events such as social, computer, supply chain and other kinds of networks. Network analysis has been used in information science probably for more than a decade especially since researchers such as Haythornthwaite (1996) highlighted the application of Social Network Analysis (SNA) techniques for the study of information exchange. However, as our search in the literature revealed that few studies have used these techniques in the context of interlibrary loan (ILL) services. The aim of this study is to analyze the network of ILL services using SNA techniques. Log files of ILL services have valuable information about relationships between scientific institutions and universities. By analyzing this network, we can discover knowledge about information flow between institutions in a national scale. This knowledge is a valuable asset to support decision making process in the context of resource sharing initiatives. We draw the network of information flow between Ghadir project participants (an Iranian national interlibrary loan service). The networks include inter-cities and inter-institutions networks. We also draw subject networks for some specific subject categories, and calculate SNA metrics such as centrality, in-degree, out-degree and betweenness.
Our case study is an Iranian ILL service called Ghadir. Currently there are two types of ILL services in Iran: AMIN and Ghadir. In AMIN, which was described in another paper (Jamali et al., 2010) users make requests for the service to their own academic library and then the library borrows the items from other libraries that hold them and delivers them to its client. In Ghadir, which is somewhat similar to SCONUL Access in the UK, members of one academic library go to another university's library themselves and request the item in person. Iranian Research Institution for Information Scientific and Technology (IRANDOC) acts as the coordinator in both services. Ghadir was piloted in 1995 and launched in 1999. It covers 240 libraries in 66 universities and research institution which are affiliated to the Ministry of Science, Research and Technology (Alidousti, Asadi & Khosrowjerd, 2012; Alidousti, Nazari & Ardakan, 2008).
Social Network Analysis (SNA) is a rich field in terms of research literature. Haythornthwaite (1996), more than a decade ago, wrote an introductory paper to introduce SNA techniques for the study of information exchange. Her paper received more than two hundred citations but none is related to the study of ILL services or resource sharing. However, there are other studies that could be considered somehow related.
Borgatti and Li (2009) used SNA in supply chain context. They investigated basic concepts in SNA and discussed the meaning of different types of network style. Supply chain consists of companies, vendors and manufacturer that have relationship with each other to supply manufacturing demands. ILL network can also be considered a supply chain whose elements interact to meet information demands.
Fritsch and Kauffeld-Monze (2010) studied the impact of network structure on knowledge transfer in the context of innovation network using SNA. They showed that the strong ties are more valuable for the exchange of knowledge and information than weak ties. As mentioned before, our searches in the literature did not lead us to any related work that has applied SNA to ILL services. A few studies such as Jamali et al. (2010) used graph representation for the study of ILL services. In terms of studying Iranian ILL, there are only two English articles, one (Alidousti et al., 2008) is a survey studying success factor for resource sharing among Ghadir participant institutions and the other (Jamali et al., 2010) is a cost-benefit analysis of AMIN project. We believe this study is one of the firsts to apply SNA techniques to ILL services.
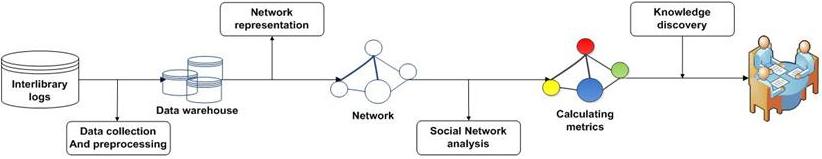
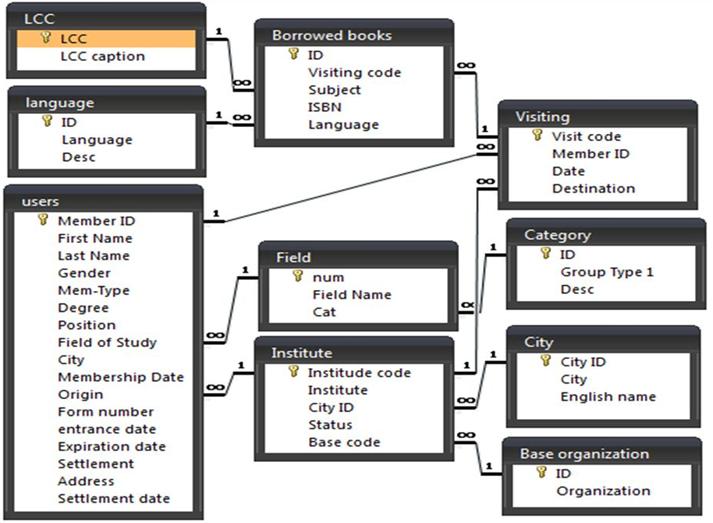
The research process is illustrated in Figure 1. First we obtained ten years (2000 to 2010) of Ghadir logs from IRANDOC and processed them to create a data warehouse. Unfortunately the Ghadir system is a DOS-based system with a FoxPro database. All the tables are flat without any relations. As a result of Persian codepages, data conversion needed special middleware. Furthermore, due to manual data entry in Ghadir system and because of the diversity in data sources, we needed to perform some pre-processing to prepare the data for our data warehouse. We used data cleansing as part of the pre-processing phase. After pre-processing, data of about 61,000 users, 158,000 visits and 160,000 borrowed books from 240 institutions were collected in the data warehouse. Microsoft Access 2007 was used as Database Management System platform. Using SQL queries data was prepared for mapping stage. Figure 2 shows the data model of our data warehouse.
The next step was network representation of users' transactions. NodeXL package version 1.0.1.196 was used. NodeXL is an Excel add-in that displays and analyzes network graphs. It is mostly used for social network analysis. We drew different kinds of network with different purposes. Then we calculated network metrics and analyzed the results in order to discover knowledge about Ghadir services. One of the networks we drew was subject networks. Books were classified using either Library of Congress Classification (LC) or Dewey Decimal Classification (DDC). Since we needed a unified classification system for drawing the networks, we converted DDC codes to LC ones using a spreadsheet conversion map.
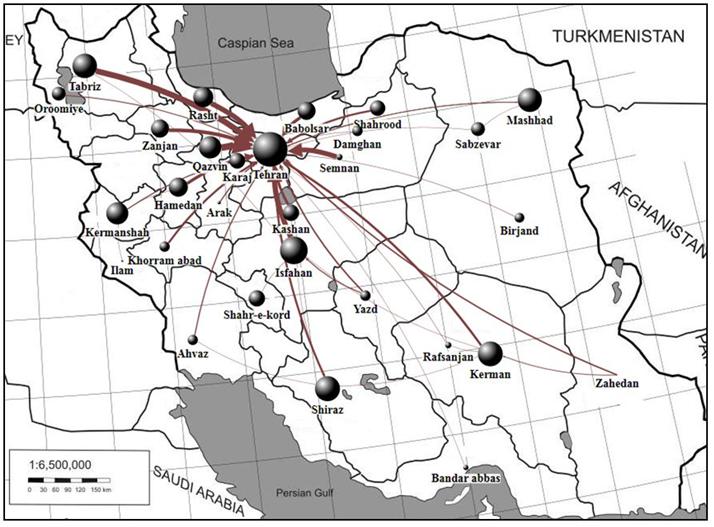
Figure 3 illustrates the information flow network of Iranian cities which is overlaid on a geographic map. The size of nodes indicates the amount of borrowed books by institutions of the given city. Due to large differences between the lowest and the highest usage by each city, we had to take the logarithm of the values to determine the size of the nodes. As it is clear from the network, Tehran, the capital, serves like the hub of Ghadir project and Qazvin, Tabriz and Isfahan have the highest amount of relationship with it. The network also shows that neighbor cities and provinces such as Kerman & Rafsanjan, Sabzevar & Mashhad, and Isfahan & Yazd have the most interactions with each other.
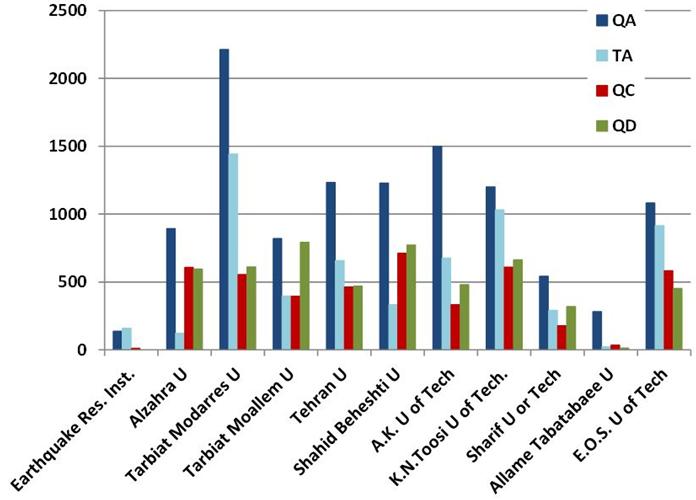
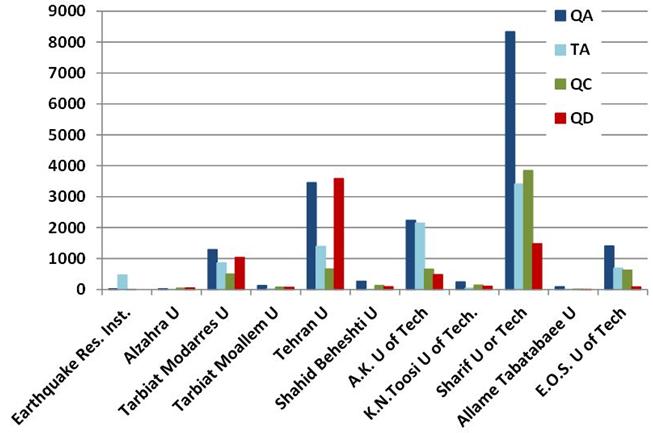
We identified the most commonly used subjects based on the usage of 10 years. These subjects are mathematics (QA), engineering-general (TA), physics (QC) and chemistry (QD) respectively. Because of the large number of Ghadir member institutions, we limited the subject network only to the ones located in Tehran province. Figure 4 shows the total amount of borrowed books by the institutions in Tehran in specified subjects and Figure 5 shows the total amount of borrowed books from these institutions.
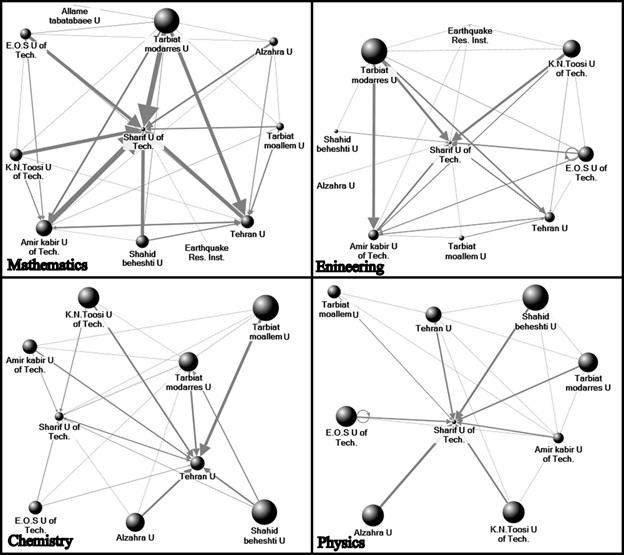
The network representation of origin-destination was drawn using NodeXL. Figure 6 represents the networks of these four subjects for Tehran institutions. The size of nodes represents the amount of total usage in specified subjects. The thickness of connections indicates the quantity of borrowing from destination institutions that are indicated by the arrows.
In the next step, we calculated the centrality measures for the networks. Centrality measures are some of the most fundamental and frequently used measures of network structure (Newman, 2008). There are three different measures for centrality including degree, closeness and betweenness.
Due to characteristics of our networks, we had to calculate these measures with attention to edges weight. Opsahl, Agneessens and Skvoretz (2010) proposed an algorithm for calculating centrality in weighted networks. They also developed Software entitled tnet for analysis of weighted, two-mode, and longitudinal networks that work as part of R package. In this research, we used tnet to calculate weighted measures for those institutions located in Tehran. Table 1 shows the metrics for mathematics and chemistry in Tehran institutions.
| University | Subject | Betweenness | Number of links | in-degree | Number of links | out-degree | Closeness |
|---|---|---|---|---|---|---|---|
| Tehran U | Chemistry | 52 | 13 | 2,587 | 8 | 425 | 30.25 |
| Mathematics | 1 | 12 | 2,171 | 10 | 1,233 | 37.69 | |
| Tarbiat Moallem U | Chemistry | 25 | 9 | 48 | 10 | 792 | 23.73 |
| Mathematics | 0 | 9 | 94 | 11 | 819 | 19.95 | |
| Tarbiat Modarres U | Chemistry | 19 | 12 | 811 | 10 | 610 | 20.08 |
| Mathematics | 25 | 14 | 995 | 13 | 2,212 | 41.26 | |
| Alzahra U | Chemistry | 0 | 6 | 31 | 8 | 594 | 19.96 |
| Mathematics | 31 | 4 | 18 | 13 | 893 | 22.67 | |
| Sharif U of Tech | Chemistry | 44 | 11 | 1,099 | 9 | 318 | 18.54 |
| Mathematics | 115 | 13 | 5,404 | 9 | 541 | 55.81 | |
| K.N. Toosi U of Tech | Chemistry | 0 | 8 | 69 | 9 | 651 | 12.23 |
| Mathematics | 0 | 9 | 96 | 9 | 1,201 | 32.03 | |
| Amir Kabir U of Tech | Chemistry | 0 | 8 | 367 | 7 | 475 | 11.92 |
| Mathematics | 31 | 13 | 1,585 | 13 | 1,498 | 38.77 |
Data in Table 1 supports what can be inferred from the graphs. For instance, Sharif University has the largest in-degree value in math and the second largest value in chemistry; and the University of Tehran has the largest value in chemistry and the second largest value in math. The number of links indicates the number of institutions connected to the given institution. Closeness centrality and betweenness centrality both are based upon on the concept of network paths (Newman, 2008). The closeness centrality of node i is the mean geodesic distance from vertex i to every other vertex. A geodesic path is the shortest path, in terms of number of edges traversed, between a specified pair of vertices. A node has high betweenness if it lies along many shortest paths between pairs of others (Borgatti & Li, 2009). Betweenness gauges the extent to which a node facilitates the flow in the network (Otte & Rousseau, 2002). According to Table 1, Sharif University of Technology has the biggest closeness and betweenness in maths. It is interesting that although Tarbiat Modarres University has bigger closeness in chemistry than Sharif, but has much less betweenness. This implies that Tarbiat Modarres University has probably a rich library collection in chemistry while Sharif plays a key role in communication between other institutions.
Studying Ghadir ILL logs as an example, we tried to show what types of information SNA can reveal. Considering the range of data recorded in ILL logs a range of networks can be generated which at least include:
Each of the above networks can be generated for all subjects, for specific subjects, for different types of items, or for different types of users (i.e., graduate students, faculty members and so on).
Visual representation of networks can reveal insightful knowledge about the state of services and the role of institutions in document sharing. However, relying only on the network graphs has its own pitfalls. For example, for very large networks with many nodes and edges, graphs cannot be very helpful. Therefore, network measures should be calculated in order to gain a better understanding of the information flow within the network and obtain objective evidence and information to support decision making. Centrality measures, for instance, can tell us which nodes play a more "central" role in the network of information exchange (Opsahl et al., 2010). Using SNA techniques one can find out about the possible weakness or strength in subject collections of institutions. This information can help librarians make collection building decisions and plan for better cooperation with institutions that are geographically close to them in order to reduce the costs of resource sharing both for libraries and their clients.